Bell Curve Fitment in IT Companies: A Practical Guide for HR and Business Leaders
Bell curve fitment is one of the most discussed performance management practices in corporate HR. When used carefully, it helps organizations differentiate performance, reward high contributors, identify development needs and bring consistency to appraisal decisions.
Executive summary: Bell curve fitment should not be treated as a mechanical forced-ranking exercise. For IT companies, it works best when performance criteria are measurable, role groups are comparable, evidence is documented and calibration is conducted with fairness, transparency and business context.
What is bell curve fitment?
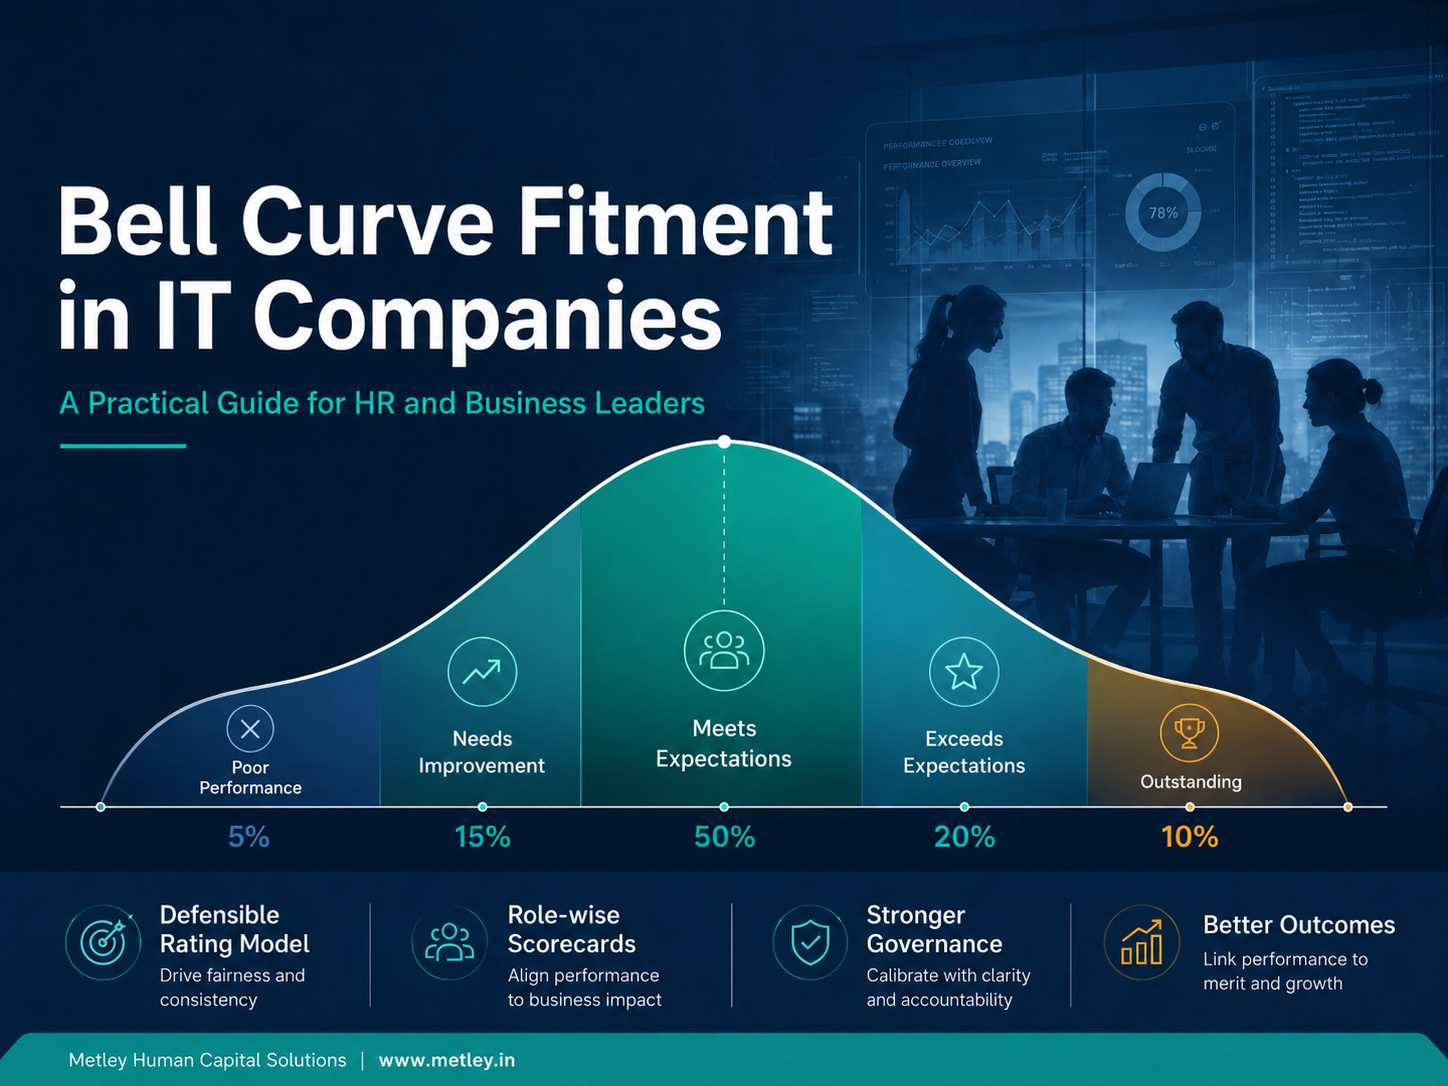
Bell curve fitment is a performance distribution method where employees are placed into predefined rating bands such as Outstanding, Exceeds Expectations, Meets Expectations, Needs Improvement and Poor Performance. The purpose is to differentiate performance across a comparable employee population and align rewards, increments, promotions and development actions accordingly.
In simple terms, bell curve fitment answers a difficult HR question: if everyone contributed differently, how should the organization fairly distinguish the exceptional, the consistent, the developing and the underperforming employees?
Why IT companies use bell curve fitment
Typical bell curve rating bands
| Rating Band | Meaning | Indicative Distribution | HR Action |
|---|---|---|---|
| A / Outstanding | Consistently exceptional contribution | Top 10% | High increment, bonus, promotion consideration, retention focus |
| B / Exceeds Expectations | Strong contribution beyond role expectations | Next 20% | Good increment, growth opportunities, leadership pipeline |
| C / Meets Expectations | Reliable and consistent role performance | Middle 50% | Standard increment, capability-building plan |
| D / Needs Improvement | Performance gaps against expected standards | Next 15% | Coaching, development plan, close monitoring |
| E / Poor Performance | Significant and repeated underperformance | Bottom 5% | Performance improvement plan, role review or separation decision where appropriate |
Step-by-step bell curve fitment process
-
Define performance criteria
Start with measurable parameters such as project delivery, code quality, defect leakage, productivity, SLA adherence, client feedback, innovation, teamwork, ownership and learning agility.
-
Assign performance scores
Managers should rate employees using evidence, not memory or personal preference. Examples include sprint outcomes, ticket resolution reports, project milestones, client appreciation, escalation records and peer feedback.
-
Create comparable groups
Compare employees within similar roles, grades and work contexts. For example, compare L2 Java Developers with L2 Java Developers, not with architects, interns or HR executives.
-
Rank employees within each group
Employees are ranked from highest to lowest based on final performance scores and supporting evidence. Ranking should be reviewed carefully to avoid bias.
-
Fit employees into rating bands
The ranked list is mapped into predefined bands. For a group of 100 employees, the organization may place 10 in A, 20 in B, 50 in C, 15 in D and 5 in E.
-
Conduct calibration meetings
HR and business leaders review rating decisions across teams to ensure fairness, consistency and evidence-based differentiation.
-
Link outcomes to rewards and development
Final ratings may influence increment, bonus, promotion, succession planning, learning interventions or performance improvement plans.
Real-time IT example: Banking support project
Consider a 10-member support team working for a banking client. Their performance is measured using SLA adherence, ticket resolution quality, client feedback, availability and teamwork.
| Employee | Score | Fitment Band | Reason |
|---|---|---|---|
| Asha | 94 | A | Resolved critical tickets and received client appreciation |
| Manoj | 89 | B | Strong SLA adherence and consistent quality |
| Divya | 84 | B | Good quality, teamwork and ownership |
| Farhan | 78 | C | Reliable delivery and meets expectations |
| Ritu | 75 | C | Consistent performer with stable output |
| Nikhil | 71 | C | Average performance with improvement scope |
| Swati | 68 | C | Some SLA delays but acceptable contribution |
| Karthik | 61 | D | Requires stronger ownership and speed |
| Bala | 55 | D | Repeated escalation and inconsistent closure quality |
| John | 42 | E | Poor response time and client complaints |
How bell curve fitment impacts compensation
Many organizations connect the final rating band to salary increments, bonus payouts and promotion decisions. A typical approach may look like this:
| Band | Indicative Increment Range | Talent Decision |
|---|---|---|
| A | 12% to 18% | Fast-track growth, promotion and retention focus |
| B | 8% to 12% | Strong reward and development opportunities |
| C | 4% to 7% | Standard increment and capability building |
| D | 0% to 3% | Coaching and performance improvement plan |
| E | 0% | Structured PIP or role suitability review |
Risks HR leaders must manage
Bell curve systems can create dissatisfaction if employees feel the process is forced, opaque or unfair. The most common risk is that good employees may receive a lower rating simply because the distribution requires someone to be placed at the bottom.
Best practices for fair implementation
| Do | Avoid |
|---|---|
| Use objective performance data and documented evidence | Relying only on manager opinion or recent memory |
| Compare employees in similar roles and grades | Comparing freshers with senior managers or unrelated functions |
| Conduct HR-led calibration meetings | Allowing each manager to apply ratings differently |
| Communicate expectations early in the year | Surprising employees with year-end low ratings |
| Use PIP as a development support mechanism | Using low ratings only as a disciplinary tool |
Conclusion
Bell curve fitment can help IT companies manage performance differentiation, rewards and development decisions. However, its success depends on fairness, evidence, calibration and communication. HR teams should design the process around business realities while protecting employee trust and organizational culture.
The most effective performance systems are not those that merely categorize people. They are systems that help employees understand expectations, improve capability and contribute meaningfully to business outcomes.
Need the complete report?
Download the full Metley Human Capital Solutions report with expanded frameworks, tables and implementation guidance.